Is Morris Park Safe? Bronx Livability, Crime & Rent
Morris Park scores a 6.4—an above-median Bronx neighborhood with strong tree cover and few housing violations, offset by moderate noise and longer commutes.
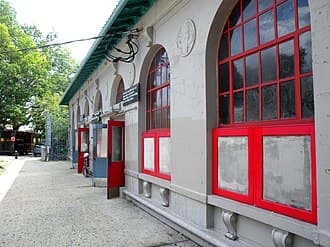
Morris Park at a glance
- Borough
- Bronx
- Livability score
- 6.4/10
- Borough rank (NYC Open Data guides)
- #1 of 22
- Safety verdict
- Safer Than Average
- Crimes (12 mo)
- 1,704
- ZIP codes
- 10461 (66%), 10462 (34%)Share of residential units, NYC PLUTO 26v2
- Subway stations
- 1 (Morris Park)
- Data updated
- 2026-09-14
Is Morris Park Safe?
Morris Park, Bronx scores 6.4/10 for overall livability, ranking #1 of 22 Bronx neighborhoods scored from NYC Open Data. Morris Park scores a 6.4—an above-median Bronx neighborhood with strong tree cover and few housing violations, offset by moderate noise and longer commutes.
The livability score draws on HPD housing violations, subway access, NYC Parks' tree inventory and parks, and 311 noise complaints per resident from NYC Open Data, refreshed periodically rather than live. It does not include crime; NYPD complaint and shooting figures are on the Morris Park safety page. Safety varies by block — check a specific Morris Park address below for a block-level breakdown.
Score Overview
Vertical line = borough median. Scale: 0-10.
Practical measures HPD housing violations per residential lot over the last 12 months (higher = fewer violations). Borough medians are computed across DwellCheck's Bronx neighborhood guides.
Neighborhood Character
Morris Park is a densely tree-lined neighborhood where you'll walk past an average of 212 trees within 200 meters and experience strong Italian-American roots along Morris Park Avenue. The streets are lined entirely with walk-up buildings, creating a low-rise, pedestrian-scaled environment that feels residential and established. You're within walking distance of Loreto Playground and benefit from direct access to the Morris Park subway station (5 train), though the commute score reflects longer travel times to major employment centers. The neighborhood has a lower crime rate per resident than 62% of Bronx neighborhoods, with stable incident levels (1,704 total crimes over 12 months), and 1,817 noise complaints, a moderate rate per resident.

Livability & Restoration
Trees
212 trees
Expected in a 200m circle (NYC Parks tree inventory) | Density: 8.1/10 (city percentile)
In Toronto, 10 more trees on a city block went with a rise in self-rated health comparable to being 7 years younger (Kardan et al., 2015, Scientific Reports). In a cross-sectional study of London boroughs, each additional street tree per km of street went with 1.18 fewer antidepressant prescriptions per 1,000 residents (Taylor et al., 2015, Landscape and Urban Planning).
Park Access
1 park
NYC Parks properties inside the neighborhood | largest: Loreto Playground | nearest to the center: Loreto Playground, 298m | 3 nearest average 298m from the neighborhood's center
Acoustic Quality
4/10
Noise proxy score (higher = quieter)
Environmental noise exposure increases the occurrence of hypertension and cardiovascular disease; WHO's night-noise guidelines call average outdoor night noise above 55 dB increasingly dangerous for public health (Basner et al., 2014, The Lancet).
What is the ART Score?
ART stands for Attention Restoration Theory (Kaplan & Kaplan, 1989) — the framework environmental psychologists use to measure whether a place helps your brain recover from mental fatigue, or pushes it deeper into overload. Cities deplete directed attention (the effortful focus you use at work); exposure to restorative environments replenishes it.
DwellCheck uses the idea in two separate places, and they measure different things. The neighborhood ART score below comes from neighborhood-wide data: up to 5 points from tree density (a city percentile) and up to 5 from how few 311 noise complaints there are per resident. An address report has no ART score. It runs the Wellness checks below, and their points go into the address’s overall score.
More than a point above the Bronx median: denser trees, fewer noise complaints per resident, or both.
What an address report checks instead (Wellness)
- ±Sensory environment. A calm score minus a busy score, each starting at 50. Busy: a firehouse within 100m (+15) or 200m (+8), and 311 noise complaints within 200m over 6 months (15+ adds 5, 40+ adds 12, 80+ adds 20, and 3 more at 20+ complaints that include vehicle or street noise). Calm: a library (+15), community garden (+12) or public plaza or atrium (POPS; +15 indoor, +8 outdoor) within 200m, and a park within 300m (+10; +15 at 1+ acre; +20 at 5+ acres). A difference of +20 or more adds 8 points; −10 to −29 costs 2; −30 or less costs 4. Bars, museums, tourists and foot traffic are not counted.
- +Third places (Oldenburg, 1989). Public libraries, public plazas and atriums (POPS) and community gardens within 400m: 1–2 add 5 points, 3 or more add 10. Cafés and community centers are not counted. In a meta-analysis of longitudinal studies, loneliness or social isolation went with a 29% higher risk of incident coronary heart disease (Valtorta et al., 2016, Heart).
- 0Street vitality (Jacobs, 1961). Permitted block parties, farmers markets and similar community events in the borough over the past 12 months. The event data has no coordinates, so this is a borough-wide count shown for context. It doesn’t change the score.
Health mechanism. The theory holds that natural settings let directed attention recover. The evidence is mixed: a systematic review of 31 studies (Ohly et al., 2016, Journal of Toxicology and Environmental Health, Part B) found that time in natural environments improved 3 of 13 pooled attention measures (Digit Span Forward, Digit Span Backward and Trail Making Test B) and showed no marked benefit on the other 10.
Theoretical foundations. Kaplan & Kaplan (1989), The Experience of Nature; Jacobs (1961), The Death and Life of Great American Cities; Oldenburg (1989), The Great Good Place.

Transit & Commute
Subway Stations
Commute Score
3/10
Borough median: 5/10

Outdoor & Green Space
Avg Tree Count
212
Trees expected in a 200m circle
Tree Density
8.1/10
1,684 trees per km² in NYC Parks' tree inventory (street and park trees); city percentile, 1 = sparsest
Largest Parks In or Near the Neighborhood
- Loreto Playground
Nearest to the neighborhood's center: Loreto Playground, about 298m. The 3 nearest NYC Parks properties average 298m from the center (approximate park centers, not entrances).

Practical Living
Practical (HPD violations): 9/10 (Bronx median 4). It measures HPD housing violations per residential lot over the last 12 months (higher = fewer violations).
Building Mix (Residential Tax Lots)
Share of the 3,594 residential tax lots in the neighborhood by PLUTO building class (NYC Department of City Planning).
Who Morris Park Is For
People prioritizing walkable streets and green space
ART/Livability score of 5.6 (above borough median) paired with above-median tree density (212 avg within 200m, tree density 8.1/10) creates strong pedestrian appeal
Community-oriented residents seeking established neighborhoods
Established Italian-American character and proximity to Montefiore Medical Center anchor the area, though you'll need to accept higher noise
Pros & Cons
Strengths
Above-median tree density
212 trees average within 200m radius with 8.1/10 tree density—substantial greening for a Bronx neighborhood
Few housing violations
Practical score of 9 (more than double borough median of 4) reflects a low rate of HPD housing violations per residential building
Direct subway access with established character
Morris Park (5 train) station provides transit connectivity; neighborhood anchored by Montefiore Medical Center and Italian-American heritage
Trade-offs
Moderate noise levels
1,817 noise complaints recorded, a moderate rate per resident
Long commute times to major employment areas
Commute score of 3 (below borough median of 5) reflects distance from Manhattan job centers despite direct subway access
Score Any Address in Morris Park
Get detailed livability scores based on building health, transit access, safety, noise levels, and 15+ NYC data sources.
Search an Address in Morris ParkFrequently Asked Questions about Morris Park
1Is Morris Park safe?
By NYPD data, Morris Park is rated "Safer Than Average", with a lower crime rate per resident than 62% of Bronx neighborhoods. 1,704 crime incidents and 2 shooting incidents over the past 12 months. See the safety page for the full breakdown.
2What is the average rent in Morris Park?
Rents in Morris Park, Bronx vary significantly by building and apartment type. Market pricing isn't aggregated for this neighborhood yet; use DwellCheck to research specific addresses for HPD registration, HPD violations, and other building-level records. DwellCheck doesn't show rent-stabilization status; request the apartment's rent history from DHCR for that.
3How is transit access in Morris Park?
Morris Park has a commute score of 3/10. 1 subway stations serve the area: Morris Park.
4What are the best streets in Morris Park?
The best streets depend on your priorities. Use DwellCheck to compare specific addresses across livability, safety, transit, and environmental factors.
5What is Morris Park known for?
Morris Park sits in Bronx and ranks #1 of 22 Bronx neighborhoods scored from NYC Open Data on DwellCheck's livability score (6.4/10). It's served by 1 subway station (Morris Park). Morris Park scores a 6.4—an above-median Bronx neighborhood with strong tree cover and few housing violations, offset by moderate noise and longer commutes.
6What is it like to live in Morris Park?
DwellCheck scores Morris Park, Bronx from NYC Open Data on practical (HPD housing violations per residential lot over the last 12 months (higher = fewer violations)), commute (subway stations and lines in the neighborhood), ART (tree density and 311 noise complaints per resident), outdoor (trees and park proximity). Morris Park's composite is 6.4/10. Morris Park scores a 6.4—an above-median Bronx neighborhood with strong tree cover and few housing violations, offset by moderate noise and longer commutes. For the block-by-block view, run any specific Morris Park address through DwellCheck.
7Where is Morris Park?
Morris Park is in the Bronx, New York City. DwellCheck maps it to the Morris Park Neighborhood Tabulation Area (BX1102), which falls in the Census tabulation area that approximates Bronx Community District 11 (Pelham Parkway-Morris Park). Its main ZIP codes are 10461 and 10462. Subway stations in the neighborhood include Morris Park.
8What ZIP code is Morris Park in?
Morris Park spans ZIP codes 10461 (66% of residential units) and 10462 (34%). Shares are of the 9,211 residential units in the Morris Park Neighborhood Tabulation Area (BX1102), from NYC PLUTO 26v2 tax-lot records.
9Can you walk around Morris Park at night?
Morris Park is classified as "Safer Than Average" by NYPD complaint data. Over the past 12 months it recorded 2 shooting incidents and 1,704 total crime incidents. Walking at night carries the same risk profile as anywhere in NYC: stay on commercial corridors with foot traffic, avoid empty side streets after midnight, and prefer subway lines that run 24/7.
10Is Morris Park dangerous?
By NYPD data, Morris Park is rated "Safer Than Average", with a lower crime rate per resident than 62% of Bronx neighborhoods. 1,704 crime incidents over 12 months. Block-level risk varies; check the address-level safety score for any specific street or building.
11What parts of Morris Park should I avoid?
NYPD complaint records carry approximate incident coordinates, but a neighborhood total can't tell you which blocks drive it, so we don't publish an "avoid this street" list. For a specific block, use DwellCheck's address-level safety score, which counts NYPD crime complaints within a 300m radius of the building over the latest 12 months of published data and compares that count with the borough average.
12Is Morris Park a good place to live?
Morris Park scores 6.4/10 for overall livability and has a lower crime rate per resident than 62% of Bronx neighborhoods. Morris Park scores a 6.4—an above-median Bronx neighborhood with strong tree cover and few housing violations, offset by moderate noise and longer commutes. Whether it's a good fit depends on what you weight: families, solo renters, and remote workers each prioritize different factors (noise, transit access, parks, building quality).
13What is the average DwellScore in Morris Park?
The composite score is 6.4. Practical scores highest at 9; commute is lowest at 3. The neighborhood's strength lies in trees and few housing violations, weakened by commute challenges.
14How safe is Morris Park?
Morris Park is rated safer than average, with a lower crime rate per resident than 62% of Bronx neighborhoods. 1,704 total crimes in the last 12 months with a stable trend (+4.7%). Rodent complaints (71) and noise complaints (1,817) are both moderate per resident.
15What's the transit situation?
You have direct access to the Morris Park (5) station, but the Commute score of 3 (below borough median of 5) reflects longer travel times to major employment hubs like Midtown Manhattan. Best for those working in the Bronx or upper Manhattan.
16What kind of buildings are in Morris Park?
Most residential tax lots hold two-family (47%) or one-family (34%) houses, and elevator apartment buildings are rare (1%). This creates neighborhood character but limits accessibility for mobility-impaired residents.
Related Guides
NYC Building Complaints Lookup
Check any building's HPD, DOB, and 311 complaint history before signing.
30 NYC Apartment Red Flags
What to watch for at the viewing, in the listing, and on the landlord.
How to Check Your NYC Landlord
A 5-step free lookup: ACRIS ownership, HPD violations, DOB complaints, lawsuits.
Is My Apartment Rent-Stabilized?
Request a free DHCR rent history and verify stabilization status in 24-72 hours.